Graphing a Linear Equation
An equation that can be written in the form Ax + By = C is called a linear equation
because its graph is a straight line.
Here are some examples:
| 4x + 2y = 12 |
y = -2x + 8 |
y = -5 (Here, A
≠ 0.) |
x = 6
(Here, B ≠ 0.) |
We can graph a linear equation on a Cartesian coordinate system by
plotting points that satisfy the equation.
Procedure
To Graph a Linear Equation
Step 1 Make a table of ordered pairs that satisfy the equation.
Step 2 Plot the ordered pairs.
Step 3 Draw a line through the plotted points.
Note:
Since two points determine a line, you can
use any two points that satisfy the equation
to draw the line. Plotting more than two
points will help avoid errors.
Here’s how to calculate the corresponding
value for y when x = -3.
| Equation. Replace x with -3.
Multiply.
Add 12 to both sides.
Divide both sides by -6. |
4x - 6y = 24
4(-3) - 6y = 24
-12 - 6y = 24
-6y = 36
y = -6 |

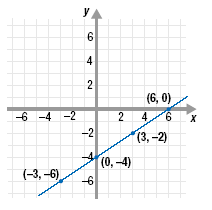
Example 1Graph the linear equation 4x - 6y = 24.
Solution
Step 1 Make a table of ordered pairs that satisfy the equation.

Select values for x and then use
4x - 6y = 24 to calculate the
corresponding values for y.
Step 2 Plot the ordered pairs.
The points are shown on the graph.
Step 3 Draw a line through the plotted points.
Each point on the line represents a solution of the equation 4x - 6y = 24.
|