Graphing Linear Equations
Objective Learn how to graph linear
equations.
The main idea of this lesson is that you can draw the graph of
a linear equation once you know two points on the graph, by
simply placing a ruler along the two points. It is typically easy
to find two points on a graph when it is in one of the standard
forms.
Key Idea
If two points on a line are known, then the line can be drawn
using a ruler.
Use a straightedge to draw the line going through the two
points at (1, 2) and (4, -2).
How do we graph a line that is given to you in the form of an
equation?
Find two points on the line.
Graphing Lines in Slope-Intercept Form
Example 1
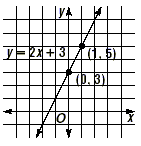
Graph y = 2 x + 3.
Solution
Two points are needed to graph this equation, which is given
in slope-intercept form. Since the y-intercept is 3, one point is
(0, 3). To find a second point, choose any other x value and
compute the corresponding y value. For instance, choose x = 1.
| y |
= 2 x + 3 |
|
| y |
= 2(1) + 3 |
Replace x with 1. |
| y |
= 5 |
|
So the point at (1, 5) is also on the line. Now graph the line
as shown on the figure below.

This works for all lines in slope-intercept form. The
y-intercept is always given and another point can be generated by
substituting any other value for x .
Graphing Lines in Point-Slope Form
Example 2
Graph y - 4 = 3( x - 2).
Solution
One point on the line is easily found when an equation is in
point-slope form. In this case, it is the point at (2, 4). To
find a second point, choose an x value different from 2, say 4,
and substitute it into the equation.
| y - 4 |
= 3( x - 2) |
|
| y - 4 |
= 3(4 - 2) |
Replace x with 4. |
| y - 4 |
= 3(2) |
|
| y - 4 |
= 6 |
|
| y |
= 10 |
Add 4 to each side. |
So the point at (4, 10) is also on the line. Draw a line going
through (2, 4) and (4, 10).

Equations in point-slope form can be graphed by first choosing
the given point. Then generate a second point by substituting a
different x value, and solving for y.
|