Graphs of Trigonometric Functions
A function f is periodic if there exists a nonzero number p such that
f(x + p) = f(s)
for all x in the domain of f. The smallest such positive value of p (if it exists) is
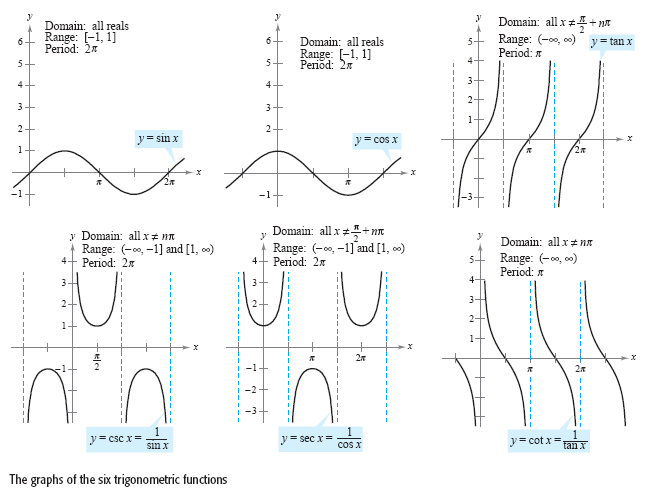
the period of f. The sine, cosine, secant, and cosecant functions each have a period
of 2π, and the other two trigonometric functions have a period of
π, as shown in
the figure below.

Note in the previous figure that the maximum value of sin x and cos x is 1 and the
minimum value is -1. The graphs of the functions y = a sin bx and y = a cos bx
oscillate between -a and a, and hence have an amplitude of
| a |. Furthermore,
because bx = 0 when x = 0 and bx = 2π when x
= 2π/b, it follows that the functions y = a
sin bx and y = a cos bx each have a period of 2π/|
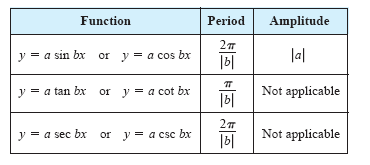
b |. The table below
summarizes the amplitudes and periods for some types of trigonometric functions.

Example 1
Sketching the Graph of a Trigonometric Function
Sketch the graph of f(x) = 3 cos 2x.
Solution
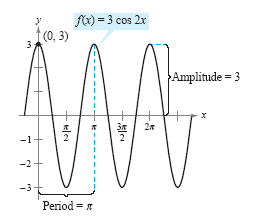
The graph of f(x) = 3 cos 2x has an amplitude of 3 and a period of 2π/2
= π. Using the basic shape of the graph of the cosine function, sketch one
period of the function on the interval [0, π],
using the following pattern.
Maximum: (0, 3) Minimum:
 Maximum:
[π, 3] Maximum:
[π, 3]
By continuing this pattern, you can sketch several cycles of the graph, as shown in
the following figure.

Horizontal shifts, vertical shifts, and reflections can be applied to the graphs of
trigonometric functions, as illustrated in Example 2.
Example 2
Shifts of Graphs of Trigonometric Functions
Sketch the graphs of the following functions.

Solution
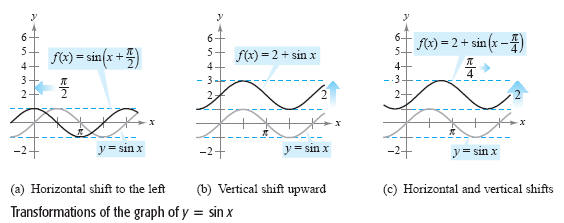
a. To sketch the graph of f(x) = sin(x + π/2), shift the graph of
y = sinx to the left π/2 units, as shown in
the figure (a) below.
b. To sketch the graph of f(x) = 2 + sin x, shift the graph of y = sin x up two units,
as shown in figure (b) below.
c. To sketch the graph of f(x) = 2 + sin(x - π/4), shift the graph of
y = sin x up
two units and to the right π/4 units, as shown in
the figure (c) below.

|